


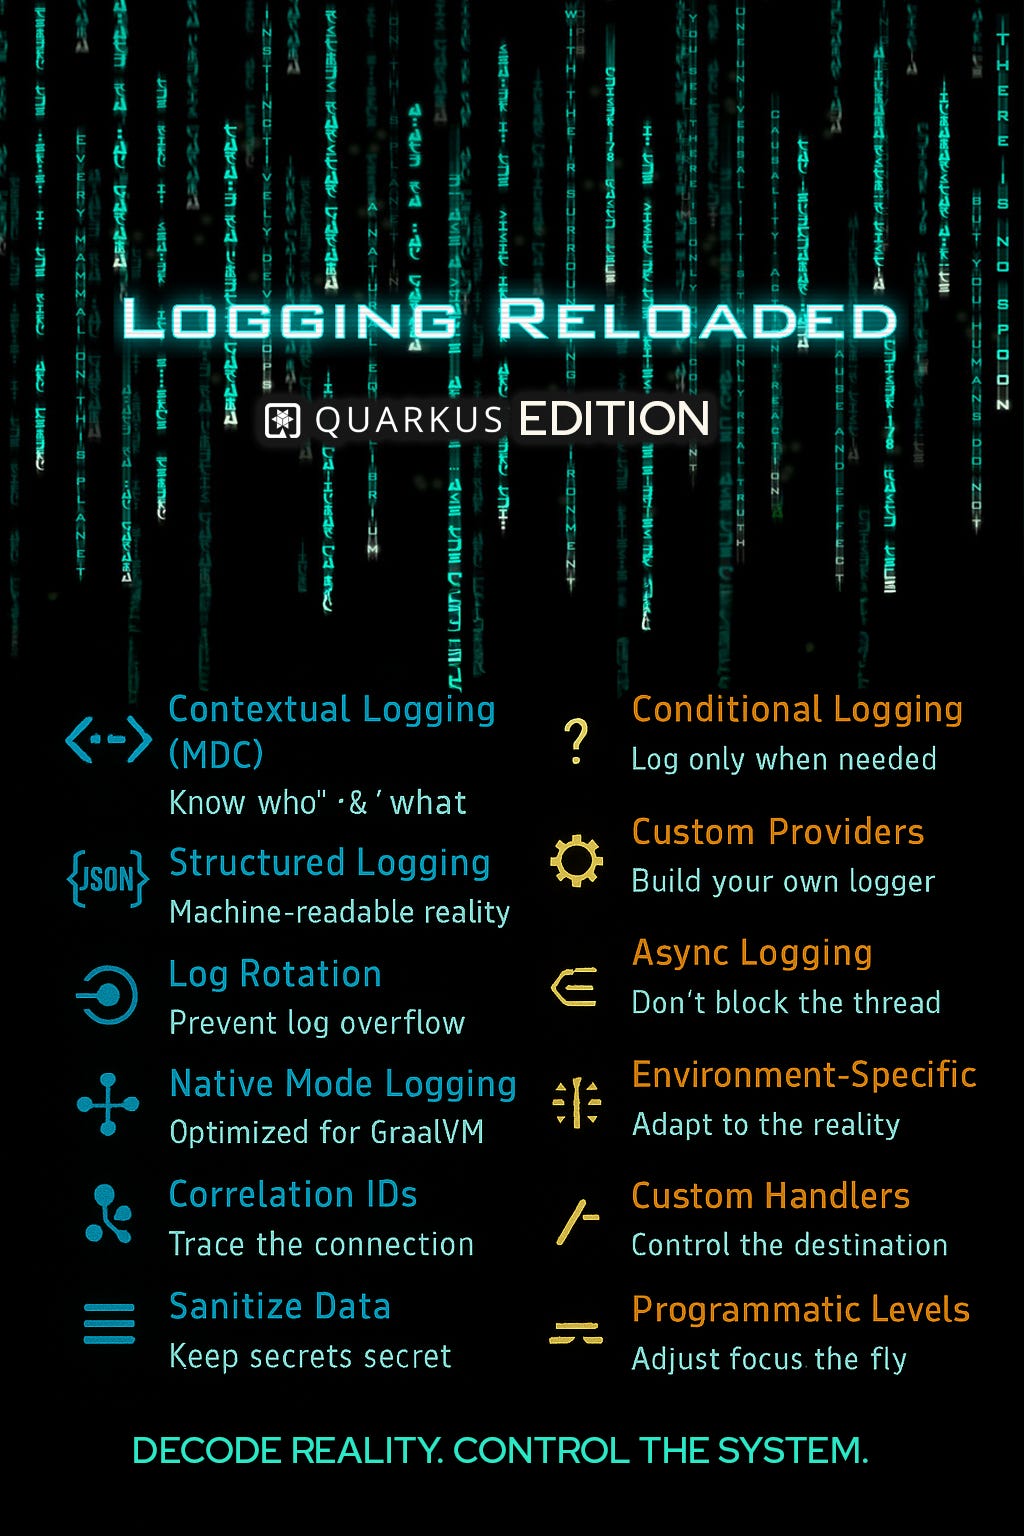
Logging Reloaded: Quarkus Edition
Logging Best Practices and Secret Tips

Effective logging is a fundamental discipline for Java developers and architects, necessary for monitoring, debugging, and maintaining applications. With Quarkus, the Kubernetes-native Java framework, using its logging capabilities well improves application observability.
This article covers essential logging practices and lesser-known techniques to help you effectively use logging in Quarkus applications, making your logs informative, efficient, and actionable. We will look at configuration fundamentals, best practices for clarity and performance, and some specific tips to apply advanced logging features.
Understanding Quarkus Logging Architecture
Before diving into practices, let's understand Quarkus's logging foundation. Quarkus employs JBoss Logging as its logging facade. This allows it to abstract the underlying logging implementation, providing flexibility.
JVM Mode: By default, Quarkus uses JBoss LogManager.
Native Mode: For native executables, it utilizes a custom SLF4J implementation optimized for GraalVM.
The key components you'll interact with include:
JBoss Logging: The facade API your application code will typically use.
Log Handlers: These components manage where log messages are sent (e.g., console, file).
Log Formatters: Control the structure and content of each log message.
Log Filters: Determine whether a specific log message should be processed based on criteria like level or content.
Essential Logging Configuration
Configuration is managed primarily through the application.properties file.
Basic Configuration
The most fundamental settings involve setting the root logging level and configuring the console output:
# Root logger configuration - Sets the default minimum level for all loggers
quarkus.log.level=INFO

# Console logging configuration - Enable and format console output
quarkus.log.console.enable=true
# Example format: Timestamp, Level, Logger Name (abbreviated), Thread, Message, Exception, Newline
quarkus.log.console.format=%d{yyyy-MM-dd HH:mm:ss,SSS} %-5p [%c{3.}] (%t) %s%e%n
quarkus.log.console.level=INFO
Category-Based Configuration
Quarkus allows fine-grained control over logging levels for specific packages or classes (categories). This is invaluable for reducing noise from verbose libraries while keeping detailed logs for your own application code:
# Set specific logger levels for different categories
quarkus.log.category."org.hibernate".level=WARN  # Quieten Hibernate logs
quarkus.log.category."io.quarkus.smallrye.jwt".level=DEBUG # Debug JWT issues
quarkus.log.category."com.yourcompany.module".level=TRACE # Detailed tracing for a specific module
File Logging Setup
For production environments or persistent log storage, file logging is essential. Configure the file path, rotation policies, and format:
# Enable and configure file logging
quarkus.log.file.enable=true
quarkus.log.file.path=logs/quarkus.log  # Log file location
quarkus.log.file.level=INFO             # Minimum level for file logs
quarkus.log.file.format=%d{yyyy-MM-dd HH:mm:ss,SSS} %-5p [%c{3.}] (%t) %s%e%n

# Configure log rotation to manage file size
quarkus.log.file.rotation.max-file-size=10M    # Rotate when file reaches 10MB
quarkus.log.file.rotation.max-backup-index=5   # Keep up to 5 backup files
Best Practice #1: Contextual Logging with MDC
In distributed systems or complex applications, understanding the context of a log message is vital. The Mapped Diagnostic Context (MDC) allows you to enrich logs with contextual data (like request IDs or user IDs) associated with the current thread.
Implement a JAX-RS filter to automatically add context from incoming requests:
import org.jboss.logging.MDC;
import jakarta.ws.rs.container.ContainerRequestContext;
import jakarta.ws.rs.container.ContainerRequestFilter;
import jakarta.ws.rs.container.ContainerResponseContext;
import jakarta.ws.rs.container.ContainerResponseFilter;
import jakarta.ws.rs.ext.Provider;

@Provider
public class LoggingContextFilter implements ContainerRequestFilter, ContainerResponseFilter {

    @Override
    public void filter(ContainerRequestContext requestContext) {
        // Example: Get a request ID header
        String requestId = requestContext.getHeaderString("X-Request-ID");
        if (requestId != null) {
            MDC.put("requestId", requestId);
        }
        // Example: Get user info (implement getUserIdFromSecurityContext accordingly)
        String userId = getUserIdFromSecurityContext(); // Replace with actual user retrieval logic
        if (userId != null) {
         MDC.put("userId", userId);
        }
    }

    @Override
    public void filter(ContainerRequestContext requestContext,
                      ContainerResponseContext responseContext) {
        // Clear MDC data after the request is processed to avoid memory leaks
        MDC.clear();
    }

    private String getUserIdFromSecurityContext() {
        // Implement logic to extract user ID from security context if available
        // Example: return SecurityContextHolder.getContext().getAuthentication().getName();
        return "user-placeholder"; // Placeholder
    }
}
Update your log format in application.properties to include the MDC fields:
# Include MDC fields in the log format using %X{key}
quarkus.log.console.format=%d{...} %-5p [%c{3.}] [requestId:%X{requestId}] [userId:%X{userId}] %s%e%n
quarkus.log.file.format=%d{...} %-5p [%c{3.}] [requestId:%X{requestId}] [userId:%X{userId}] %s%e%n
Best Practice #2: Structured Logging (JSON)
Structured logging formats logs as JSON objects, making them easily parseable by log aggregation and analysis tools (like ELK Stack, Splunk, Graylog). Quarkus makes this simple:
# Enable JSON output for the console handler
quarkus.log.console.json=true
quarkus.log.console.json.pretty-print=false # Disable pretty printing for efficiency in prod

# Optionally enable for file logging too
quarkus.log.file.json=true
Now, your logs will be emitted as structured JSON, ready for machine processing.
Best Practice #3: Implement a Log Rotation Strategy
Unmanaged log files can consume vast amounts of disk space. Quarkus provides robust log rotation settings:
quarkus.log.file.enable=true
quarkus.log.file.path=logs/quarkus.log

# Rotation settings
quarkus.log.file.rotation.max-file-size=10M     # Max size before rotation
quarkus.log.file.rotation.max-backup-index=10   # Number of backup files to keep
quarkus.log.file.rotation.file-suffix=.yyyy-MM-dd # Suffix for rotated files (e.g., .2025-04-01)
quarkus.log.file.rotation.rotate-on-boot=true   # Rotate logs when the application starts
Choose max-file-size, max-backup-index, and file-suffix based on your log volume and retention requirements.
Best Practice #4: Logging Considerations for Native Mode
When compiling to a native executable with GraalVM, there are specific logging considerations:
Build-Time Configuration: Logging configuration is largely processed at build time. Runtime changes via configuration files might not be fully reflected.
Dynamic Patterns: Avoid overly dynamic logging patterns that rely heavily on runtime reflection, as this can interfere with GraalVM's static analysis.
Custom Formatters: If using custom log formatters or handlers, ensure they are registered for reflection using
@RegisterForReflectionor build-time properties.Resource Registration: Sometimes, logging resources might need explicit registration during the native build:
# Example: Ensure logging resources are included in the native image
quarkus.native.additional-build-args=-H:Log=registerResource:1
Best Practice #5: Correlation IDs for Distributed Tracing
In microservices, tracing a request across multiple services is crucial. Integrate logging with distributed tracing by including trace or span IDs in your logs using MDC. If you're using OpenTelemetry or another tracing library, you can often automatically propagate these IDs.
Example integrating with a hypothetical Tracer:
import io.opentracing.Tracer; // Yes OpenTracing is OLD! It's an example
import org.jboss.logging.MDC;
import org.jboss.logging.Logger;
import jakarta.enterprise.context.ApplicationScoped;
import jakarta.inject.Inject;

@ApplicationScoped
public class TracingService {
    private static final Logger LOG = Logger.getLogger(TracingService.class);

    @Inject
    Tracer tracer; // Inject your Tracer implementation

    public void logWithTracing(String message) {
        if (tracer.activeSpan() != null) {
            String traceId = tracer.activeSpan().context().toTraceId();
            String spanId = tracer.activeSpan().context().toSpanId();
            MDC.put("traceId", traceId);
            MDC.put("spanId", spanId); //
        }

        LOG.info(message); //

        // Clear MDC after logging if appropriate, or rely on a filter like LoggingContextFilter
        // MDC.remove("traceId");
        // MDC.remove("spanId");
    }
}
Ensure your log format includes traceId and spanId from the MDC.
Best Practice #6: Sanitize Sensitive Information
Logs must never contain sensitive data like passwords, credit card numbers, or personal identification information. Create a custom log formatter to sanitize messages.
package org.acme.logging;

import org.jboss.logmanager.ExtFormatter;
import org.jboss.logmanager.ExtLogRecord;

import java.util.ArrayList;
import java.util.List;
import java.util.regex.Matcher;
import java.util.regex.Pattern;

/**
 * Custom log formatter that sanitizes sensitive information from log messages.
 */
public class SanitizingLogFormatter extends ExtFormatter {

    // List of patterns to sanitize (can be expanded as needed)
    private static final List<Pattern> SENSITIVE_PATTERNS = new ArrayList<>();

    static {
        // Credit card numbers (simple pattern for demonstration)
        SENSITIVE_PATTERNS.add(Pattern.compile("\\b(?:\\d{4}[- ]?){3}\\d{4}\\b"));

        // Email addresses
        SENSITIVE_PATTERNS.add(Pattern.compile("\\b[A-Za-z0-9._%+-]+@[A-Za-z0-9.-]+\\.[A-Za-z]{2,}\\b"));

      // Add more as needed
    }

    private final ExtFormatter delegate;

    /**
     * Constructor that allows wrapping an existing formatter
     * @param delegate the formatter to wrap
     */
    public SanitizingLogFormatter(ExtFormatter delegate) {
        this.delegate = delegate;
    }

    /**
     * Default constructor that uses a default formatter
     */
    public SanitizingLogFormatter() {
        this.delegate = new org.jboss.logmanager.formatters.PatternFormatter("%d{yyyy-MM-dd HH:mm:ss,SSS} %-5p [%c] (%t) %s%e%n");
    }

    @Override
    public String format(ExtLogRecord record) {
        // First get the formatted message from the delegate formatter or create one
        String formattedMessage = delegate != null
            ? delegate.format(record)
            : record.getFormattedMessage();

        if (formattedMessage != null) {
            // Apply all sanitization patterns
            formattedMessage = sanitizeMessage(formattedMessage);
        }

        return formattedMessage;
    }

    /**
     * Sanitizes the message by replacing sensitive information with redacted markers
     * @param message the log message to sanitize
     * @return the sanitized message
     */
    private String sanitizeMessage(String message) {
        String result = message;

        for (Pattern pattern : SENSITIVE_PATTERNS) {
            Matcher matcher = pattern.matcher(result);
            StringBuffer sb = new StringBuffer();

            while (matcher.find()) {
                // Replace with [REDACTED] or appropriate replacement based on the pattern
                String replacement = getReplacementText(matcher.group(), pattern);
                matcher.appendReplacement(sb, Matcher.quoteReplacement(replacement));
            }

            matcher.appendTail(sb);
            result = sb.toString();
        }

        return result;
    }

    /**
     * Determines the appropriate replacement text based on the matched pattern
     * @param matched the matched sensitive text
     * @param pattern the pattern that matched
     * @return appropriate replacement text
     */
    private String getReplacementText(String matched, Pattern pattern) {
        // For email addresses, preserve the domain part
        if (pattern.pattern().contains("@")) {
            int atIndex = matched.indexOf('@');
            if (atIndex > 0) {
                return "[REDACTED_EMAIL]" + matched.substring(atIndex);
            }
            return "[REDACTED_EMAIL]";
        }

        // For credit card numbers, preserve last 4 digits
        if (pattern.pattern().contains("\\d{4}")) {
            String digits = matched.replaceAll("[^0-9]", "");
            if (digits.length() >= 4) {
                return "[REDACTED_CC]****" + digits.substring(digits.length() - 4);
            }
            return "[REDACTED_CC]";
        }

        // Default replacement
        return "[REDACTED]";
    }
}
Configure Quarkus to use your custom formatter:
# Specify the custom formatter class for console logging
quarkus.log.handler.file.formatter=org.acme.logging.SanitizingLogFormatter
quarkus.log.handler.console.formatter=org.acme.logging.SanitizingLogFormatter

# Optional: If you want to wrap the existing formatter
# quarkus.log.handler.file.formatter=org.acme.logging.SanitizingLogFormatter(org.jboss.logmanager.formatters.PatternFormatter("%d{yyyy-MM-dd HH:mm:ss,SSS} %-5p [%c] (%t) %s%e%n"))
Secret Tip #1: Conditional Logging for Performance
Avoid expensive string concatenation or object serialization if the log level is disabled. Check the log level before logging complex messages.
import org.jboss.logging.Logger;
// Assuming Product class exists
// import com.yourcompany.Product;

public class ProductService {
    private static final Logger LOG = Logger.getLogger(ProductService.class);

    public void processProduct(Product product) { //
        // Check level before potentially expensive operations
        if (LOG.isDebugEnabled()) { //
            // This concatenation only happens if DEBUG is enabled
            LOG.debug("Processing product: " + product.getId() +
                     " with attributes: " + product.getAttributes().toString()); // Ensure toString() is efficient or customize
        } //

        // **Even Better: Use Parameterized Logging**
        // The arguments (product.getId(), product.getAttributes()) are only processed
        // and converted to strings if DEBUG level is enabled internally by the logger.
        LOG.debugf("Processing product: %s with attributes: %s",
                 product.getId(), product.getAttributes()); // Use debugf for formatted string

        // Or using SLF4J style placeholders:
         LOG.debug("Processing product: {} with attributes: {}",
                  product.getId(), product.getAttributes()); //
    } //

    // Dummy Product class for example compilation
    static class Product {
        private String id = "P123";
        private java.util.Map<String, String> attributes = java.util.Map.of("color", "red", "size", "large");
        public String getId() { return id; }
        public java.util.Map<String, String> getAttributes() { return attributes; }
    }
}
Parameterized logging (debugf or {} placeholders) is generally preferred as the check is often handled efficiently within the logging framework itself.
Secret Tip #2: Custom Logger Providers (CDI Injection)
Leverage CDI to inject loggers directly into your beans, simplifying logger instantiation.
Create a Logger Producer:
import org.jboss.logging.Logger;
import jakarta.enterprise.context.ApplicationScoped;
import jakarta.enterprise.inject.Produces;
import jakarta.enterprise.inject.spi.InjectionPoint;

@ApplicationScoped
public class LoggerProducer {

    @Produces
    public Logger produceLogger(InjectionPoint injectionPoint) {
        // Get the class where the logger is being injected
        Class<?> declaringClass = injectionPoint.getMember().getDeclaringClass();
        return Logger.getLogger(declaringClass); //
    }
}
Now you can inject loggers easily:
import jakarta.inject.Inject;
import org.jboss.logging.Logger;

@ApplicationScoped
public class MyService {

    @Inject
    Logger logger; // Logger automatically configured for MyService.class

    public void doSomething() {
        logger.info("Doing something...");
    }
}
Secret Tip #3: Async Logging for High Throughput
For applications handling a high volume of requests or logs, synchronous logging can become a bottleneck. Configure asynchronous logging to offload log processing to a separate thread, improving application responsiveness:
# Enable async logging for console and file handlers
quarkus.log.console.async=true
# Optional: Configure queue length (default might be sufficient)
# quarkus.log.console.async.queue-length=1024

quarkus.log.file.async=true
# quarkus.log.file.async.queue-length=1024
Be aware that with async logging, there's a small chance of losing log messages if the application crashes abruptly before the queue is flushed.
Secret Tip #4: Environment-Specific Logging Profiles
Tailor logging configurations for different environments (dev, test, prod) using Quarkus profiles (%profile.<property>):
# --- Default/Base Configuration ---
quarkus.log.level=INFO
quarkus.log.console.enable=true
quarkus.log.file.enable=false # File logging disabled by default

# --- Development Profile (%dev) ---
%dev.quarkus.log.level=DEBUG # More verbose logging in dev
%dev.quarkus.log.console.format=%d{HH:mm:ss} %-5p [%c{2.}] %s%e%n # Simpler format for dev
%dev.quarkus.log.console.json=false # Human-readable console in dev
%dev.quarkus.log.category."com.yourcompany".level=DEBUG

# --- Production Profile (%prod) ---
%prod.quarkus.log.level=INFO
%prod.quarkus.log.console.json=true # Structured logging for prod console
%prod.quarkus.log.console.json.pretty-print=false
%prod.quarkus.log.file.enable=true # Enable file logging in prod
%prod.quarkus.log.file.path=logs/app.log
%prod.quarkus.log.file.level=INFO
%prod.quarkus.log.file.json=true # Structured logging for prod files
%prod.quarkus.log.file.rotation.max-file-size=20M
%prod.quarkus.log.file.rotation.max-backup-index=10
%prod.quarkus.log.category."com.yourcompany".level=INFO
Activate profiles using -Dquarkus.profile=dev or environment variables.
Secret Tip #5: Custom Log Handlers
For specialized logging requirements, like sending logs to a specific monitoring system, database, or messaging queue, implement a custom log handler.
This basic handler will just print logs to the console with a custom format. But you can do literally anything in a handler, like sending logs to a database (note, you’ll be down to handling all this by yourself, cause there is no container services in a log handler!) or even send them to a messaging system or your choice.
package org.acme.logging;

import java.util.logging.Handler;
import java.util.logging.LogRecord;

import io.quarkus.runtime.annotations.RegisterForReflection;

/**
 * A minimal custom log handler that demonstrates the core concepts.
 * This handler simply formats logs and prints them to the console.
 */
@RegisterForReflection
public class SimpleLogHandler extends Handler {

    @Override
    public void publish(LogRecord record) {
        // Skip if the record shouldn't be logged based on level
        if (!isLoggable(record)) {
            return;
        }

        // Create a simple custom format for the log
        StringBuilder sb = new StringBuilder();
        sb.append("[CUSTOM-LOG] ");
        sb.append(record.getMillis()).append(" | ");
        sb.append(record.getLevel().getName()).append(" | ");
        sb.append(record.getLoggerName()).append(" | ");
        sb.append(record.getMessage());

        // Add exception details if present
        if (record.getThrown() != null) {
            sb.append(" | Exception: ").append(record.getThrown().getMessage());
        }

        // Print the formatted log to console
        System.out.println(sb.toString());
    }

    @Override
    public void flush() {
        // Nothing to flush in this simple implementation
        System.out.flush();
    }

    @Override
    public void close() throws SecurityException {
        // No resources to close in this simple implementation
    }
}
Register the handler in application.properties:
# Register our custom handler
quarkus.log.handler.custom.enabled=true
quarkus.log.handler.custom.handler-class=org.acme.logging.SimpleLogHandler
quarkus.log.handler.custom.level=INFO

# Keep the default console handler
quarkus.log.console.format=%d{HH:mm:ss} %-5p [%c{2.}] (%t) %s%e%n
Secret Tip #6: Programmatic Log Level Adjustment
Dynamically adjust log levels at runtime without restarting the application. This is extremely useful for temporarily enabling detailed debugging in production for specific components.
package org.acme.logging;

import org.jboss.logging.Logger;

import jakarta.ws.rs.*;
import jakarta.ws.rs.core.MediaType;
import jakarta.ws.rs.core.Response;

@Path("/logging")
@Produces(MediaType.APPLICATION_JSON)
@Consumes(MediaType.APPLICATION_JSON)
public class LoggingResource {

    private static final Logger LOG = Logger.getLogger(LoggingResource.class);

    @GET
    @Path("/test")
    public Response testLogging() {
        LOG.trace("This is a TRACE message");
        LOG.debug("This is a DEBUG message");
        LOG.info("This is an INFO message");
        LOG.warn("This is a WARN message");
        LOG.error("This is an ERROR message");
        LOG.fatal("This is a FATAL message");

        return Response.ok().entity("{\"message\": \"Logs generated\"}").build();
    }

    @POST
    @Path("/level/{logger}/{level}")
    public Response setLogLevel(@PathParam("logger") String loggerName, @PathParam("level") String levelName) {
        try {
            // Convert the string level to org.jboss.logmanager.Level
            java.util.logging.Level level = java.util.logging.Level.parse(levelName.toUpperCase());

            // Get the logger and set its level
            java.util.logging.Logger logger = java.util.logging.Logger.getLogger(loggerName);
            logger.setLevel(level);

            return Response.ok().entity("{\"message\": \"Log level for " + loggerName + " set to " + levelName + "\"}").build();
        } catch (IllegalArgumentException e) {
            return Response.status(Response.Status.BAD_REQUEST)
                          .entity("{\"error\": \"Invalid log level: " + levelName + "\"}").build();
        }
    }

    @GET
    @Path("/level/{logger}")
    public Response getLogLevel(@PathParam("logger") String loggerName) {
        java.util.logging.Logger logger = java.util.logging.Logger.getLogger(loggerName);
        java.util.logging.Level level = logger.getLevel();

        String levelName = level != null ? level.getName() : "Not set specifically (using parent logger level)";

        return Response.ok().entity("{\"logger\": \"" + loggerName + "\", \"level\": \"" + levelName + "\"}").build();
    }
}
DO NOT leave such an endpoint unprotected please! Ensure proper authentication and authorization are in place.
Secret Tip #7: Logging Integration with Reactive Streams (Mutiny)
When using reactive programming with Mutiny, MDC context propagation across asynchronous boundaries doesn't happen automatically. You need helper utilities to capture and restore the MDC context.
import io.smallrye.mutiny.Uni;
import org.jboss.logging.MDC;
import java.util.Map;
import java.util.function.Function;
import java.util.function.Supplier;

/**
 * Utility class to help with MDC context propagation across Mutiny's asynchronous boundaries.
 */
public class MdcContextPropagator {

    /**
     * Wraps a Uni-producing function to ensure MDC context is preserved across asynchronous boundaries.
     *
     * @param uniSupplier The original function that produces a Uni
     * @param <T> The type of item emitted by the Uni
     * @return A new Uni that preserves MDC context
     */
    public static <T> Uni<T> withMdcContext(Supplier<Uni<T>> uniSupplier) {
        // Capture the current MDC context
        Map<String, String> capturedContext = MDC.getMap();

        return Uni.createFrom().item(() -> {
            // Store the original context that might be present at execution time
            Map<String, String> originalContext = MDC.getMap();

            try {
                // Restore the captured context
                restoreContext(capturedContext);

                // Call the original Uni supplier
                return uniSupplier.get();
            } finally {
                // Restore the original context that was present before we modified it
                restoreContext(originalContext);
            }
        }).flatMap(Function.identity());
    }

    /**
     * Helper method to restore an MDC context
     */
    private static void restoreContext(Map<String, String> context) {
        // Clear existing context
        MDC.clear();

        // Put all values from the captured context
        if (context != null) {
            context.forEach(MDC::put);
        }
    }

    /**
     * Wraps a function that transforms a Uni to ensure MDC context is preserved.
     *
     * @param mapper The original function that transforms a Uni
     * @param <T> The input type
     * @param <R> The result type
     * @return A new function that preserves MDC context
     */
    public static <T, R> Function<T, Uni<R>> withMdcContext(Function<T, Uni<R>> mapper) {
        // Capture the current MDC context
        Map<String, String> capturedContext = MDC.getMap();

        return input -> {
            // Store the original context that might be present at execution time
            Map<String, String> originalContext = MDC.getMap();

            try {
                // Restore the captured context
                restoreContext(capturedContext);

                // Call the original mapper
                return mapper.apply(input)
                        .onSubscription().invoke(() -> restoreContext(capturedContext))
                        .onTermination().invoke(() -> restoreContext(originalContext));
            } finally {
                // Restore the original context
                restoreContext(originalContext);
            }
        };
    }
}
Here's an example of how you would use this utility class in a Quarkus application:
import io.smallrye.mutiny.Uni;
import org.jboss.logging.MDC;
import jakarta.enterprise.context.ApplicationScoped;

@ApplicationScoped
public class MyService {

    public Uni<String> processRequest(String requestId) {
        // Set some MDC context
        MDC.put("requestId", requestId);
        MDC.put("startTime", System.currentTimeMillis());

        // Use the context propagator to preserve MDC context
        return MdcContextPropagator.withMdcContext(() ->
            fetchDataFromDatabase()
                .onItem().transform(data -> processData(data))
                .onItem().transformToUni(processed -> callExternalService(processed))
        );
    }

    private Uni<String> fetchDataFromDatabase() {
        return Uni.createFrom().item(() -> {
            // MDC context is preserved here
            String requestId = MDC.get("requestId");
            System.out.println("Fetching data for request: " + requestId);
            return "data";
        });
    }

    private String processData(String data) {
        // MDC context is preserved here too
        String requestId = MDC.get("requestId");
        System.out.println("Processing data for request: " + requestId);
        return "processed-" + data;
    }

    private Uni<String> callExternalService(String data) {
        return Uni.createFrom().item(() -> {
            // MDC context is still preserved
            String requestId = MDC.get("requestId");
            System.out.println("Calling external service for request: " + requestId);
            return "result-" + data;
        });
    }
}
Conclusion
Effective logging in Quarkus goes beyond simply printing messages. It's about building a robust observability strategy that provides deep insights into your application's behavior, streamlines troubleshooting, and ensures system health.
By applying above best practices and leveraging advanced techniques, you elevate your logs from mere text to a powerful diagnostic and analytical tool.
Treat logging as a core aspect of your application design, not a task tacked on at the end. Investing in a solid logging setup early gives you significant benefits throughout the application lifecycle, improving developer productivity and operational stability. Master these techniques, and your Quarkus applications will be significantly more transparent and manageable.